The Boston real estate market feels a bit more like watching a tennis match for the last two years instead of simply rockets taking off. Boston did not see an exodus of people leaving the city due to Covid with falling prices taking their place at the level that New York and other cities did. But. People did leave. And prices did bounce around a bit on some properties.
Are we completely past it? Rents are rising, inventory is falling, and the market is moving along.
Let’s look at some numbers for last year. We always tell clients that the best data is the data that is made for you, and for your goals.
If you are looking to make sound real estate decisions about buying, selling, or investing, let’s talk about your goals and the data that you need to get there.
Book a Phone Call or Appointment Here!

Beacon Group Real Estate – Elaine Goldman | Stephanie Ford | David Gordon | Wayne Godfrey | 857.297.4830

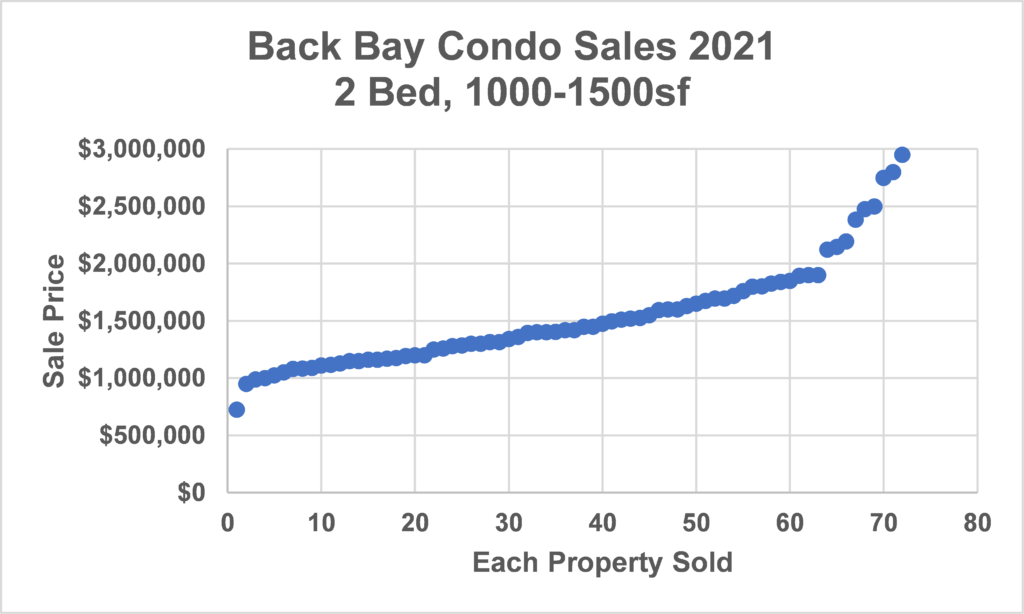
We use graphs like these to look at the context of properties within the market. Buyers can use this type of data to understand their odds of finding a particular type of property within a certain price range. Sellers can use this information to understand the demand for a property like theirs at certain prices.
We believe that median price is much more useful and information as an economic indicator than it is as a price predictor. Median price tells us about capital invested to build and develop increasingly valuable units, but that is not the same as “rising prices”. In the same way, a dropping median price often reflects dropping quality or dropping size of units and not merely dropping prices.
A graph like the two bedroom units above tells us that the sweet spot of the two bedroom market for many buyers will be the units between the median price of about $1.475M up to the inflection point of $1.9M. Those units will typically meet the wishlist of common features, be primarily in good condition, and have no major defects. To have a value above that inflection point, a unit needs to be special in some way….it is new construction, it is in a unique location, it has water views, extraordinary finishes, or remarkable design.
For the units prices between a lower inflection point of about $1.2M up to the median, those units will typically have some deficiencies compared to “ideal” units. They are off the mark in location, size, condition, or other features like parking, bathrooms, outdoor space.
Below the lower inflection point, we call those units tragically flawed. Those units, in this case below about $1.2M for a two bedroom, will most often be in basements, in fringe locations, abutting highways, or be quite small and in very poor condition.
How could a buyer use this chart to inform their search? Suppose a buyer is looking for a unit for $1M, and wants a two bedroom unit with parking, outdoor space, in unit laundry, on a parlor level or higher, that doesn’t need much work. This is a very common request, but this graph tells us that we are unlikely to find that property at that price.
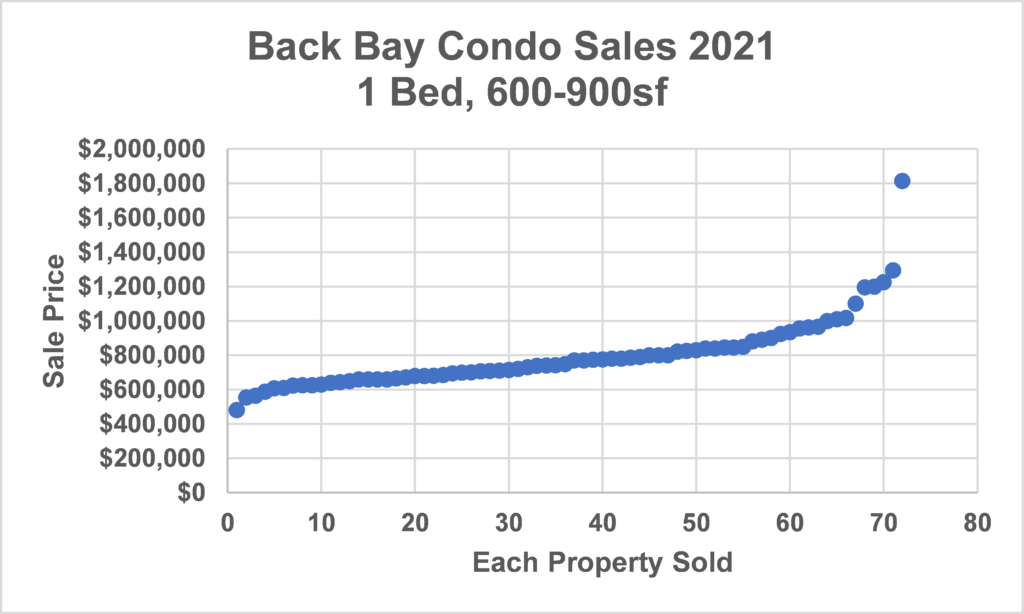
We can use additional charts to shape the search.

This graph tells us that the one bedroom units that meet that criteria for features, would typically be in the price range of $775k-$1M. So that is one solution to the search.
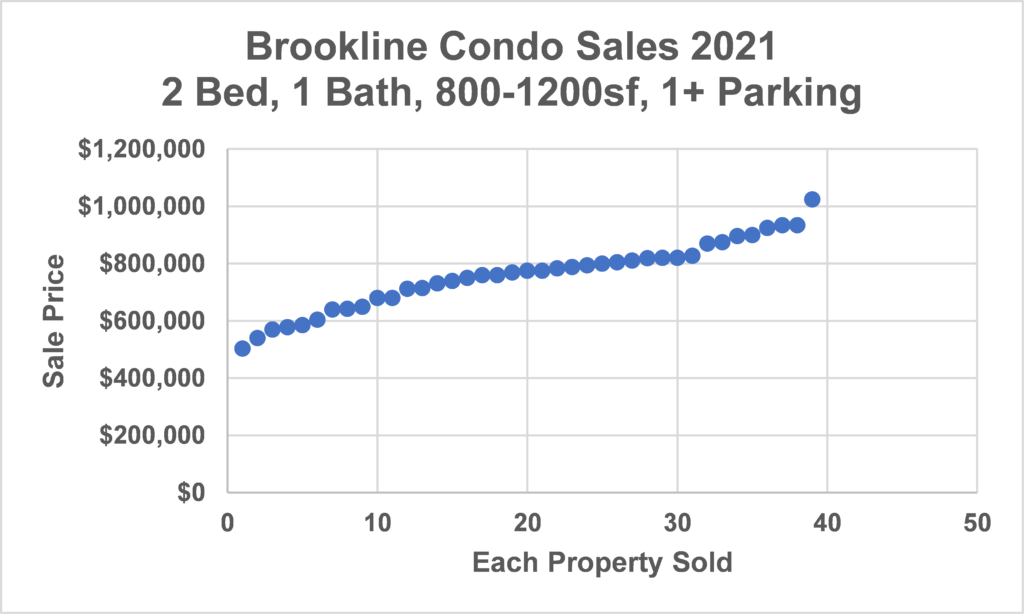
Another solution can be location.

From the Brookline graph, we can see that there might be fewer units available in a year, but that the prices are not as high.
We work with clients with these types of charts to understand how prices move in various locations with various types of properties. This gives much more context to the pricing that tracking only a data point of “median price” and trying to understand what that means for a particular property.
Truly, the most effective data analysis is the one made for your search or your sale. Let’s look at your goals together.
Book a Phone Call or Appointment Here!

Beacon Group Real Estate – Elaine Goldman | Stephanie Ford | David Gordon | Wayne Godfrey | 857.297.4830