So far this year, the story seems very much like the story of recent years. Many properties get several offers. Some of the offers are extraordinarily strong.
Some properties are selling for more over asking than ever before. And then some aren’t.
The market is different in some places, for some properties. We are watching each property and each neighborhood closely to keep an eye on local sentiment. It seems like in some places, the bloom might be a little off. In other places, we are seeing homes sell for 40-50% over their asking prices.
But did you know, that many of those statistics aren’t record-breaking? We don’t think there are any superlatives about the market that apply across the board, except the properties are older than they were before. Except, you know, the ones that have been renovated or replaced.
Even though we haven’t yet found sweeping statements to define and predict “the market”, we work with clients everyday to find the data that they need to make the most informed decisions.
We believe that real estate statistics serve many purposes. For most people, the most common use of current real estate data is cocktail party banter. We certainly would like for you to be sharp and sparkling.
(When someone exclaims about the $1m-over-asking-price sale in Cambridge that they read about in Home Section, you can find a coy/polite way to share that 30 Walker Street in Cambridge sold for $1.125M over it’s asking price. 48% over asking. In 2018. Record schemckord.)
Sometimes real estate data is for planning. Either theoretical planning, or actual planning. Could I afford to move to a larger house in the next few years? Should I do an addition on my current home? Is there a financial benefit to downsizing? How can I grow my real estate investment portfolio?
Reliable data, and the context for that data, is crucial in making buying and selling decisions for such large assets. Let’s take a look at some sales this year.
Beacon Group Real Estate Highlights for First Half 2021
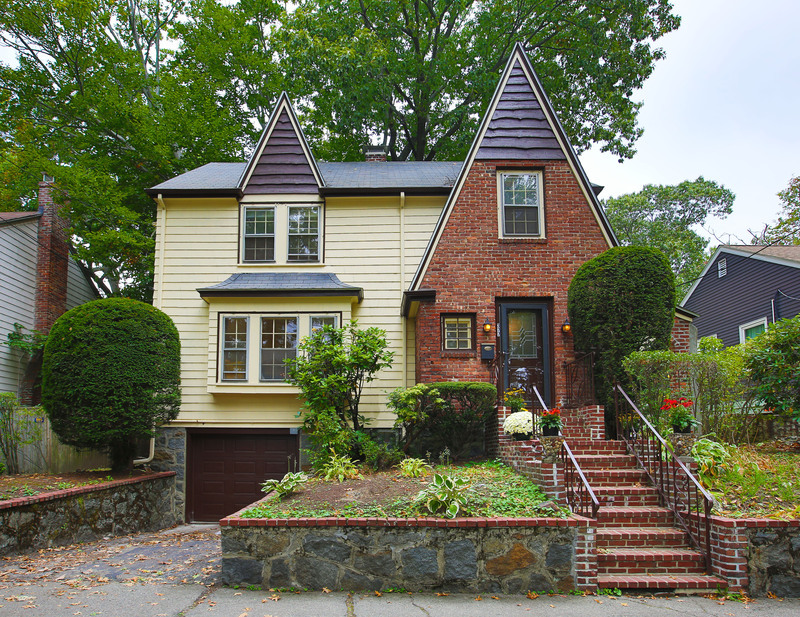
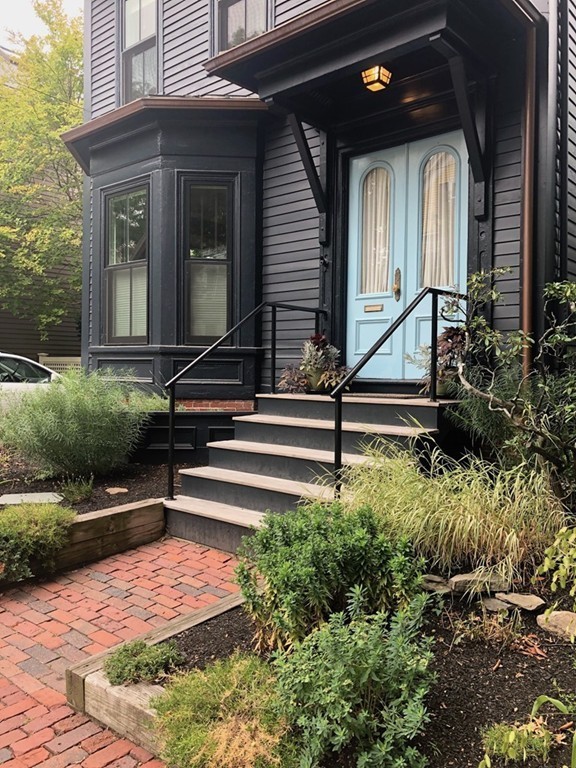
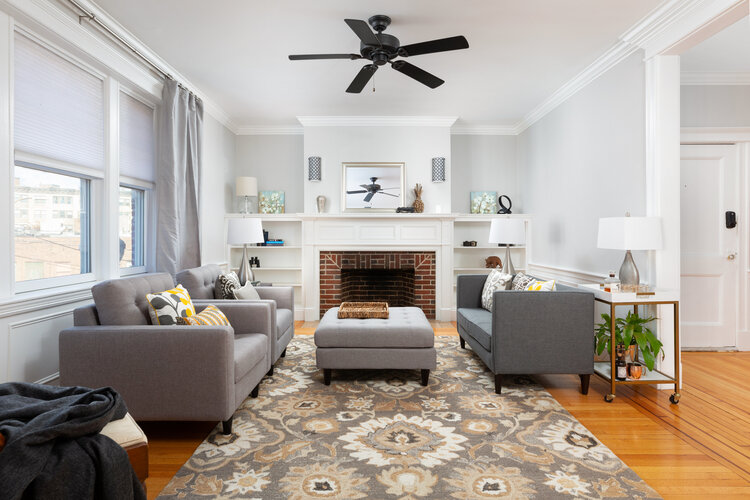
125 Park Street, Coolidge Corner, Brookline $1.3M
While the media reported “urban flight”, we found the details with our clients didn’t all fall under that umbrella. In Brookline, we had several clients “move forward” earlier than expected. Clients who lived in condos in very convenient locations for commutes or retail prioritized that less than space for home offices, outdoor space, and renovated homes. These clients had planned to move to something “more” and/or “farther out” at some point, but they did it sooner.
For several Brookline clients, this actually translated into moving into “more house”, right in the neighborhood. Instead of fleeing the city, these clients often dug deeper into their pockets and prioritized the features of the new house over all other considerations, even price. Many clients bought the new property without selling the old one, further contributing to a lack of inventory available in the market.
Working on tracking market movements and looking to price a particular property, we look at that subset of the market. The market forces driving demand for 3 bedroom condominiums aren’t the same as the those effecting 1 bedroom condominiums. We do this to see the context of pricing. Simply looking at a median price tells us more about market sentiment as an economic indicator than it does about the pricing of properties.
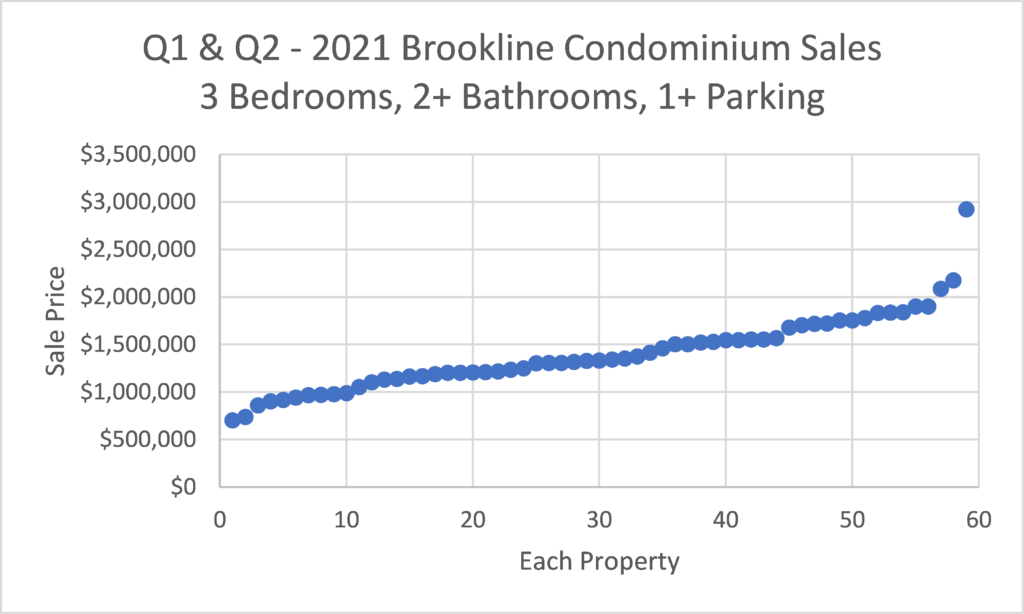
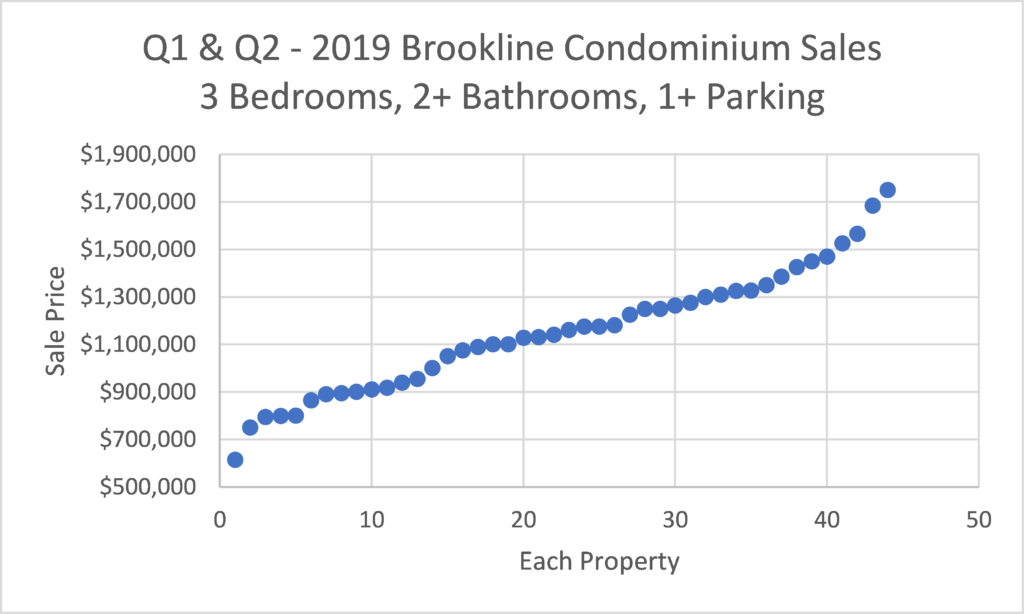
Looking at first half sales of 3 Bedrooms condominiums in Brookline across 2021 above and 2019 and 2020 below, we see that the number of sales in 2021 is up 69% over 2020. That sounds like a startling number, but what are the contributing factors? There is no “market crash” here that was predicted and reported by the media in 2020. What we saw was the demand went up sharply in 2020 as people looked to change their living situation. However, because of lock downs, and caution, and a bit of shock over the changes in our lives there were a fraction of the number of homes available to buy.
What we experienced looked much more like panic buying than panic selling.
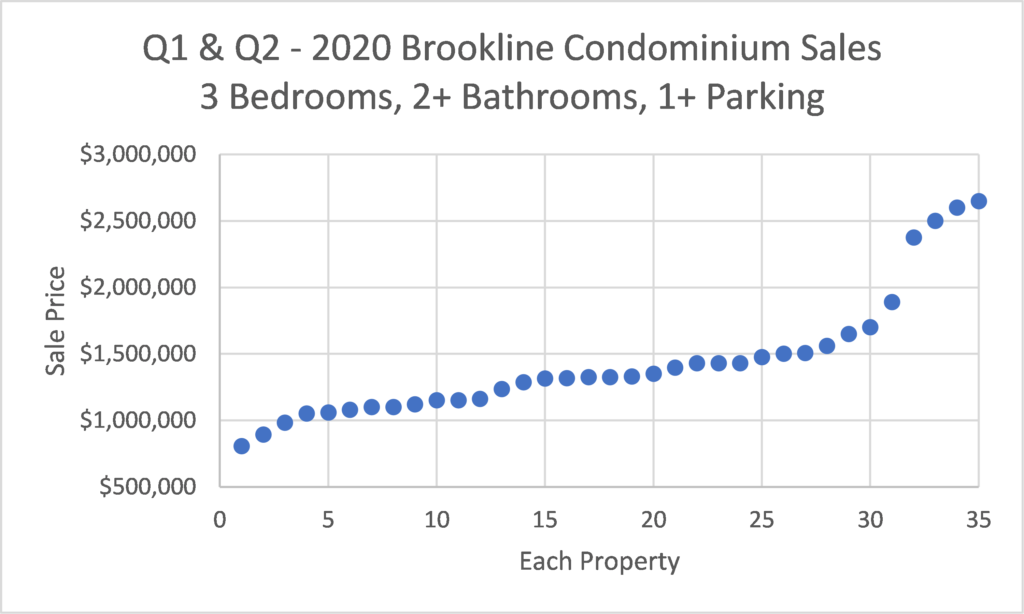
Pricing didn’t “soften” in 2020, it jumped. We don’t feel that one number reflects pricing movements. The median price rose 13% from 2019 to 2020. The impact that many people felt, however, was the change in the segment of the market from the lower inflection point around $900k in 2019 that moved up 25% to $1.125 in 2020.
That segment of the market represents the “entry level” property to a market segment. It isn’t the A+ of location. It isn’t the most amazing new renovation. But it is a 3 bedroom condominium in Brookline and there are many people that will fiercely compete to have it.
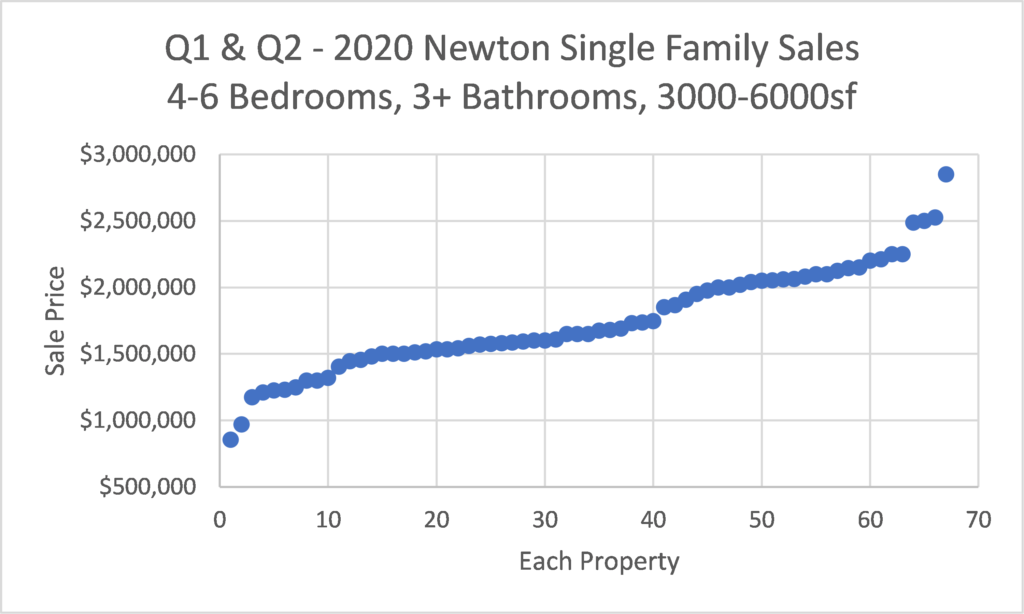
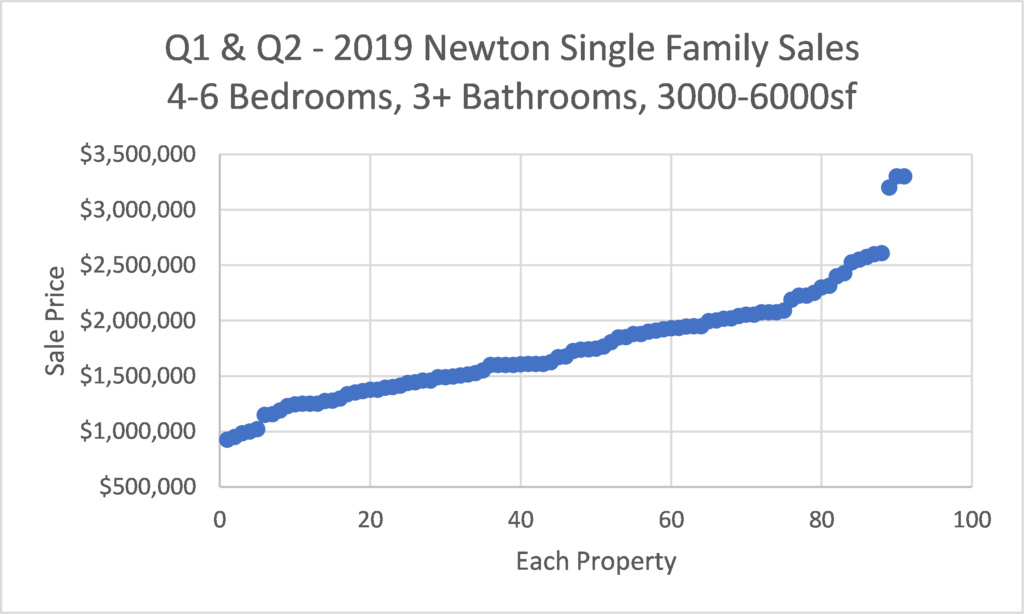
268 Dorset Road, Waban, Newton $2.45M
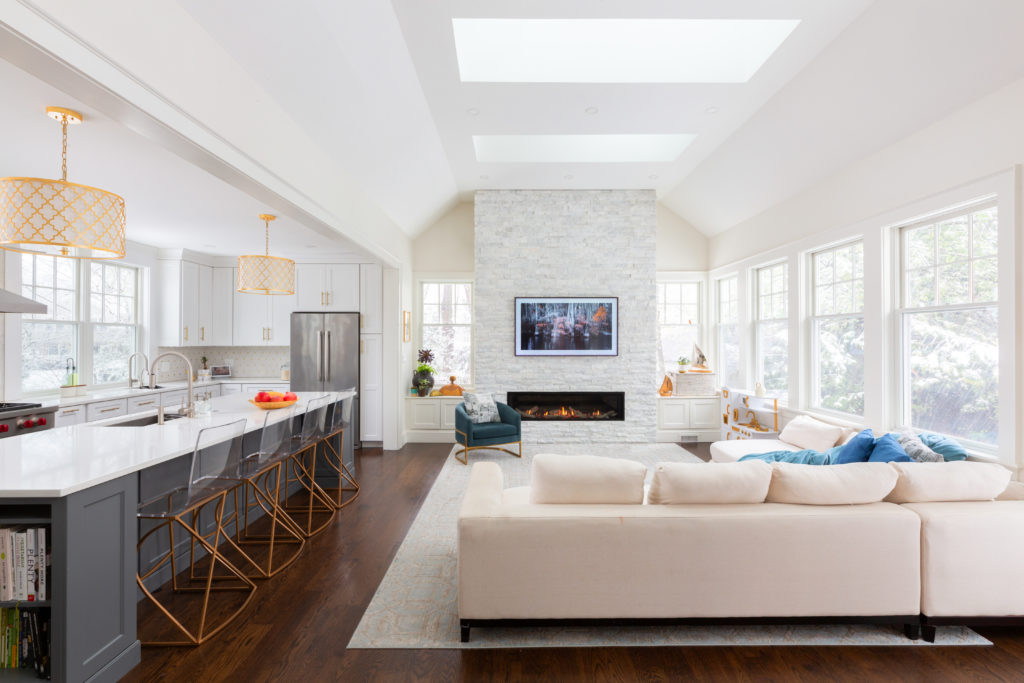
In 2020 and 2021 we see clients wanting more space and nicer homes than before. Buyers are willing to pay premiums to get a larger house, that doesn’t need work, immediately. For the well-funded buyers, this creates intense bidding for certain luxury properties.
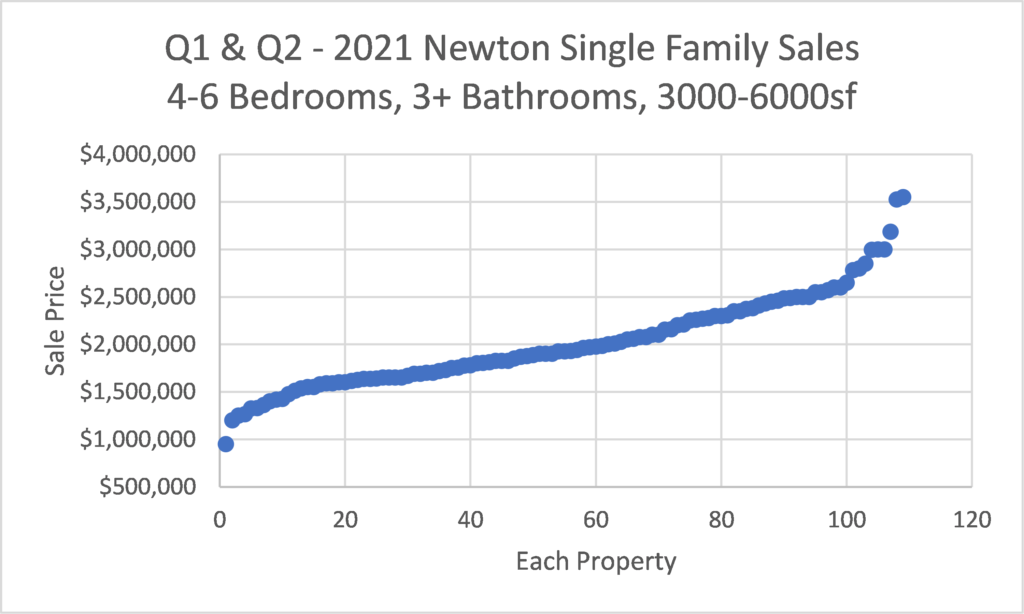
2021 shows an increase in sales over the low-inventory of 2020 and the sales of 2019. 2021 is actually a record first half for this type of luxury home. (Truly, 3 bathrooms starts to be a marker of luxurious choices for many.) Unlike Brookline, the jump in pricing comes between 2020 and 2021 instead of between 2019 and 2020. We don’t have solid answers for this discrepancy, yet. We need more time with the spreadsheets.
We do know that buyers are eager to step up and pay for move-in-ready homes. We see about a 17% increase in prices from 2020 to 2021 in Newton for these homes, compared to essentially less than a 5% increase from 2019 to 2020.
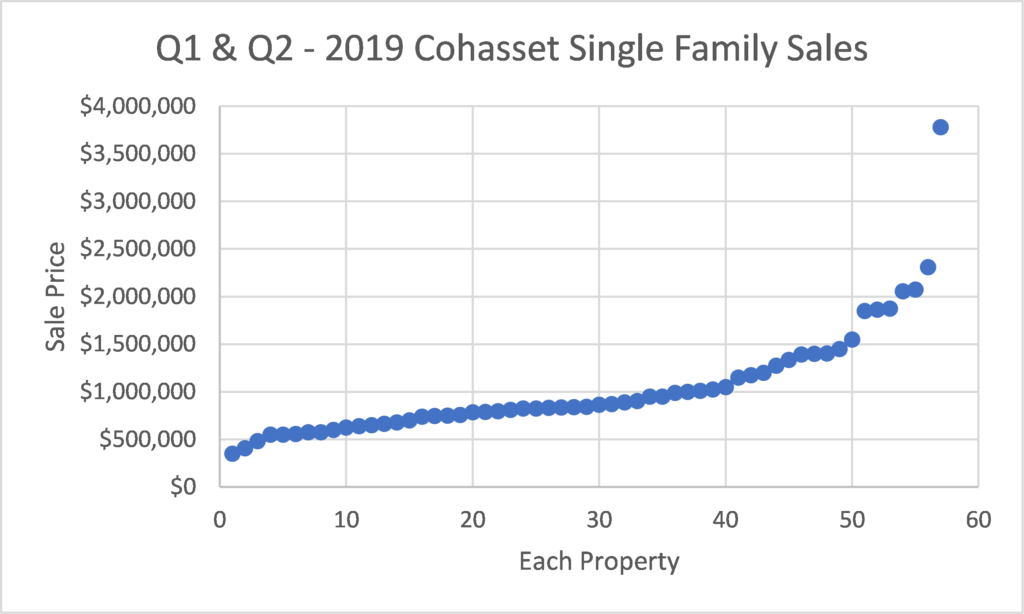
37 Heritage Lane, Cohasset $2.2M

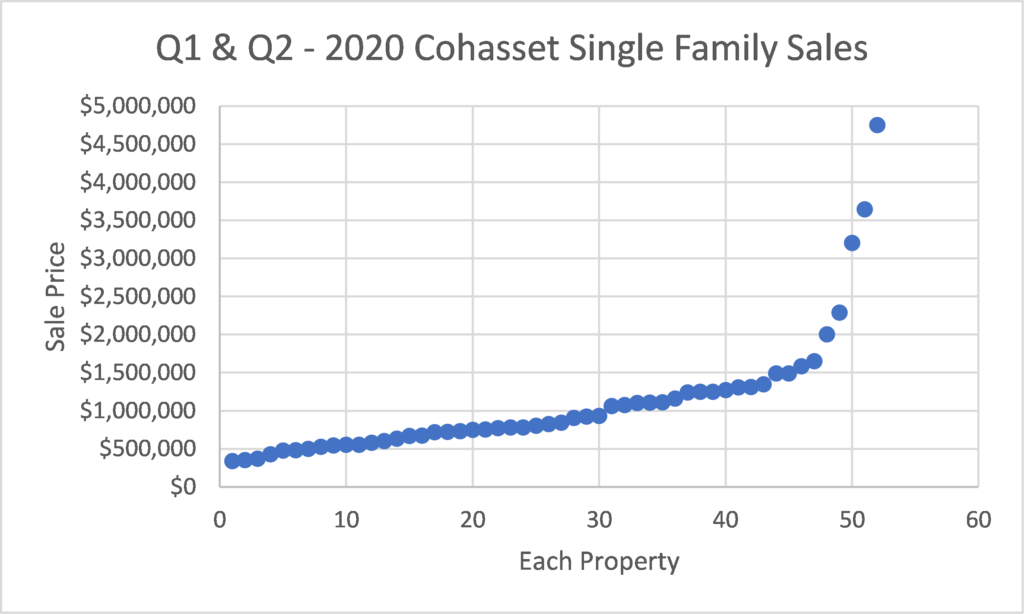
Median price up 73% in Cohasset
Isn’t that a spectacular headline? That generates a litany of responses from people who see that in the media. “OMG, prices are so high!”, “That is crazy!”, “My house is worth a fortune!”, “How could prices go up so much?”.
We find that it probably doesn’t mean what most people think it means. When we look at real estate data, especially looking at trends over time, we find that all ships do not rise and fall together. If “Median Price is Up 73%”, that doesn’t necessarily translate into “All Prices are Up 73%”, even though that is the most common thought that occurs to many people.
What a change in median price indicates, especially such a large move up, or down, is often a change in the types of properties that are available for sale. In that vein, we use median price as an economic indicator, instead of a pricing tool.
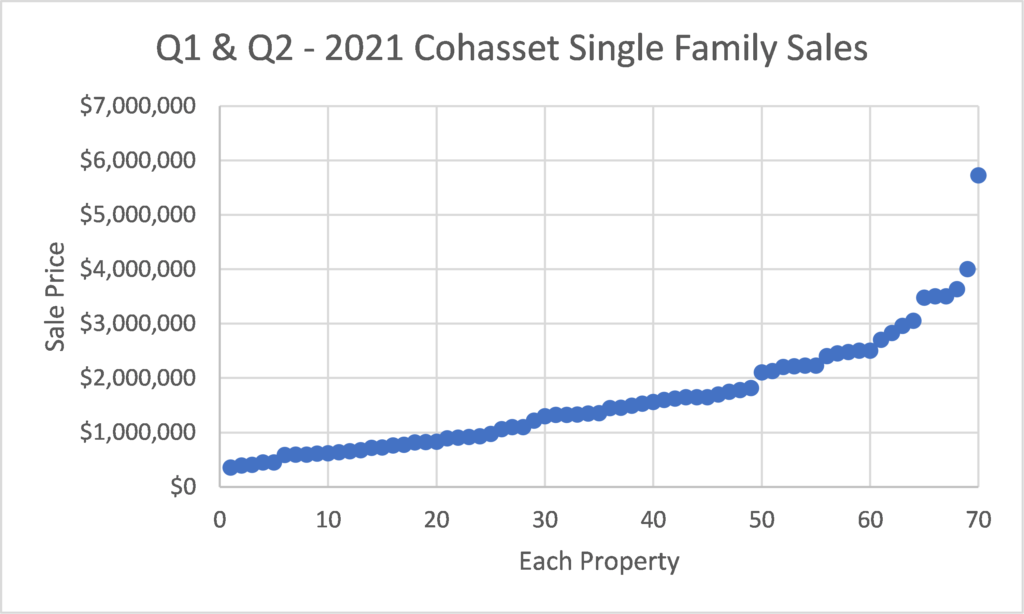
Looking at the changes in sales in Cohasset from 2019 to 2020 and then to 2021, median was unchanged from 2019 to 2020. Then median jumped over 70% from 2020 to 2021. However, if you look at the context, all the prices didn’t go up. For the lower-priced 20-30 homes that were sold in Cohasset, the pricing changed very little.
The notable change is that about 30% more houses have been sold in 2021 so far, and the additional sales are disproportionately luxury properties. People are not “dumping” properties, they are taking profits.
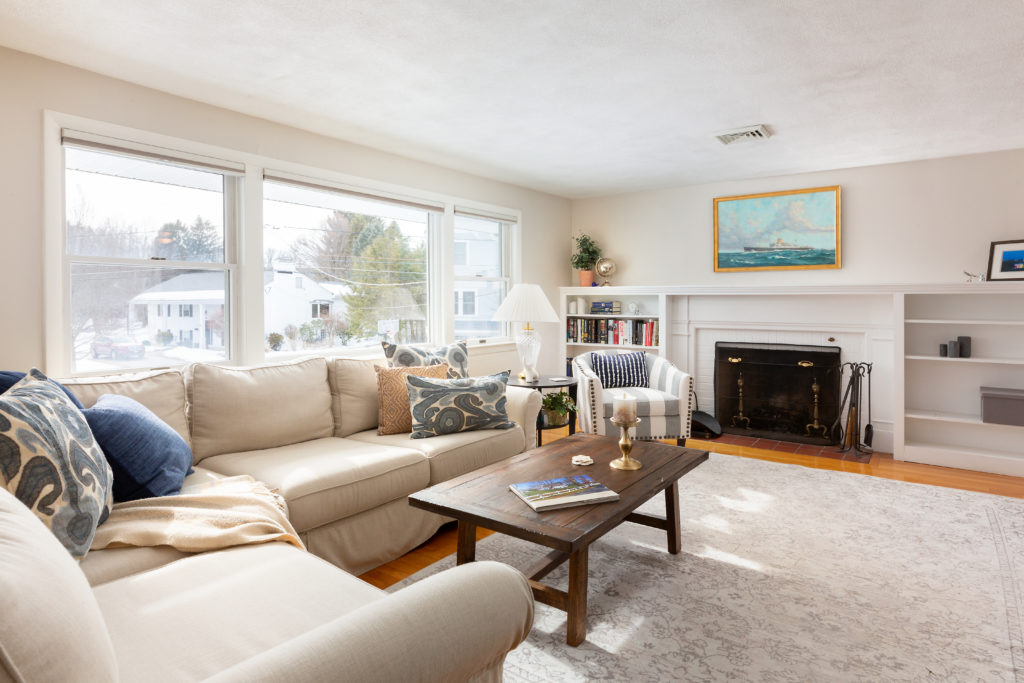
5 Cynthia Road, Needham $1M
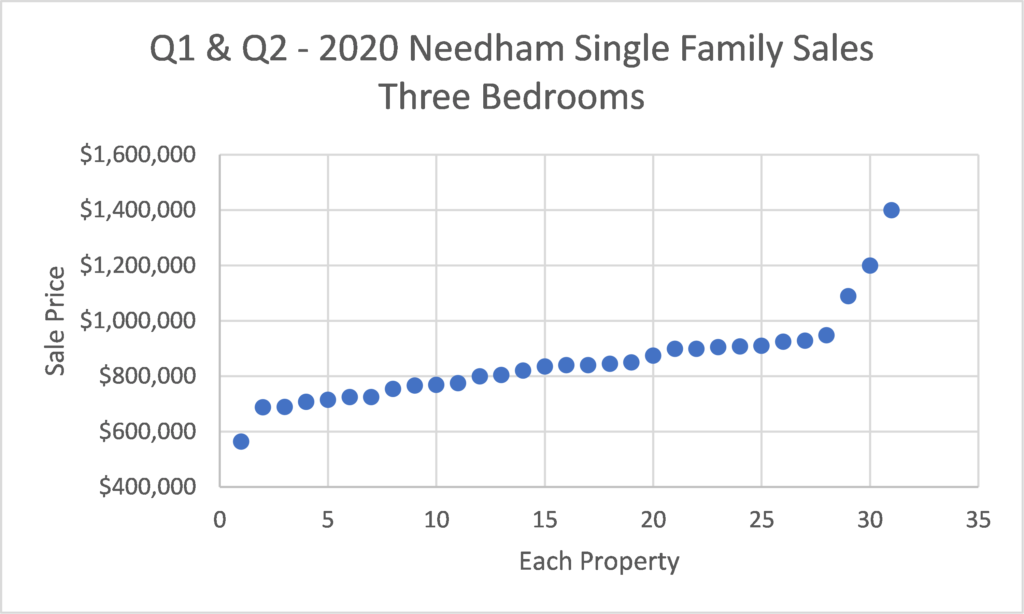
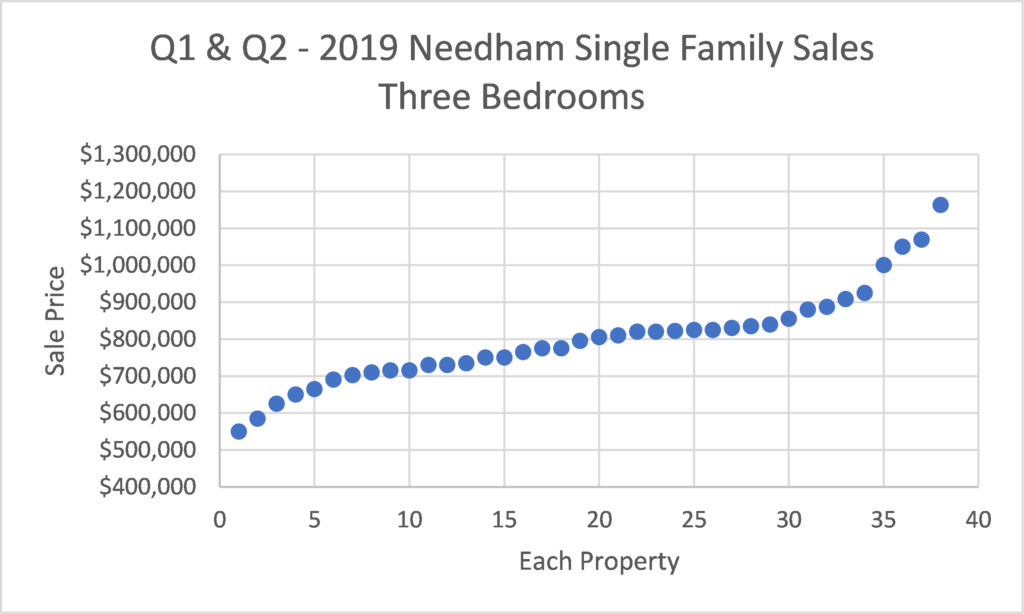
Needham is a good example of what people feel in the market, even if the numbers themselves aren’t that stark. The number of sales from year to year are comparable. Thirty Eight three bedroom homes sold in the first half of 2019, down to 31 in 2020, and back to 38 in 2021. Rising prices also don’t look that dramatic. Prices rose roughly 5% from 2019 to 2020 and another 10-12% from 2020-2021.
But buyers feel much more turmoil that those numbers might suggest. When we look across the center portion of the sale prices, between the two inflections points, in 2021 from just under $800k to about $1.1M, that is typically the most active part of the market and represents the most typical homes. These are the homes with no inherent flaws (flood zones, brown fields, adjacent to a highway, large power lines) from the “fixer upper” level of condition to the nicely renovated. Looking at the 2021 sales in Needham, we would say that the minimum to live in a three bedroom fixer-upper in Needham could be expected to be about $800k. On the higher end, for a completely renovated three bedroom home in a good location, the price would be as much as $1.1M.
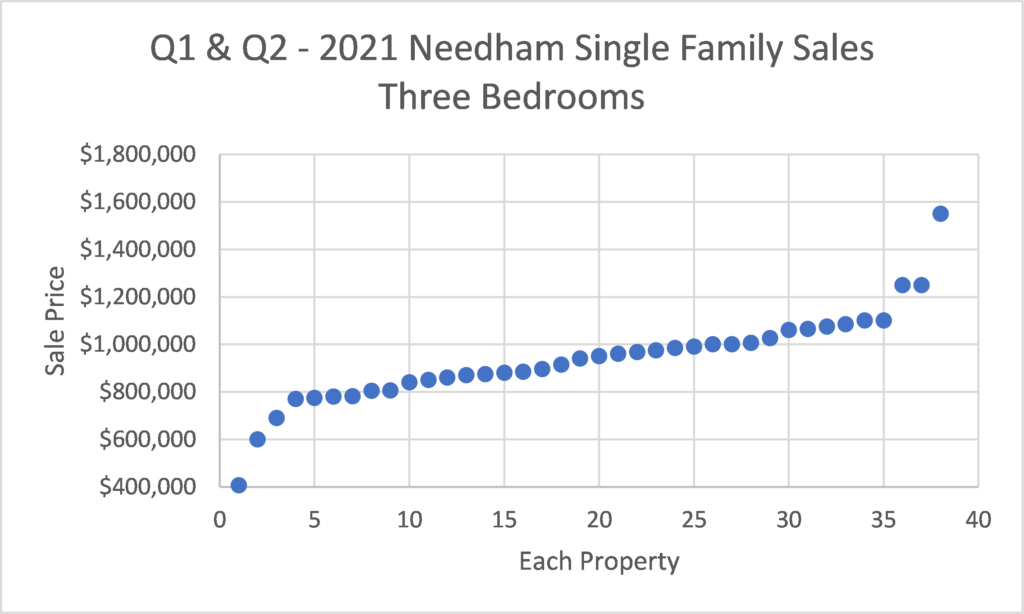
The 2021 pricing shows a sharp increase in the playing field from 2020 and 2019. The “minimum price” of $800k was closer to the median price in 2020 and 2019. While $900k would’ve purchased a nicely renovated three bedroom Needham home in 2019 and 2020, $900k would buy a much more modest home in 2021.
The buyers felt this shift in the market as being “priced out”. This lead many buyers to switching their home search to a less expensive town.
3 Parsons Way, Natick $1.185M
